BIOCLIM – the first species distribution modelling package
The problem
Species distribution modelling (SDM, also known as ecological niche modelling or habitat suitability modelling) helps to show where species may occur under past, present or future conditions. Before BIOCLIM was created efforts had been made to relate species distributions to climatic conditions, but these had been too coarse to gain much acceptance. The lack of reliable estimates for climatic conditions at sites remote from meteorological stations was a major limitation.
The solution
Modern SDM began in January 1984 with the release of the BIOCLIM package on the CSIRONET computer network. Researchers input information on individual sites where a species had been recorded, its environmental requirements were determined by the BIOCLIM package and climatically-suitable locations mapped. The ease-of-use of BIOCLIM meant it could readily be used by anyone who had latitude, longitude and elevation data describing a species’ distribution. The first BIOCLIM release included a coarse 0.5-degree digital elevation model (DEM) for prediction, soon updated with a 0.1-degree DEM. DEMs with much greater precision subsequently became available.
BIOCLIM was extensively used for studies such as species survey, conservation planning, invasive plant or animal risk assessment, reconstruction of historical distributions and climate change impact evaluation. Species as varied as rainforest trees, eucalypts, marsupial moles, brine shrimps, elapid snakes, mangroves, agricultural weeds, rock wallabies and others were evaluated by researchers around Australia. In May 1994, BIOCLIM was made available on the World Wide Web by the Environmental Resources Information Network (Department of Energy and the Environment).
The BIOCLIM program was prepared as a collaborative project of CSIRO Water and Land Resources and the Federal Government’s Bureau of Flora and Fauna (BFF, also known as the Australian Biological Resources Study). The key participants were Henry Nix (CSIRO), John Busby (BFF) and Michael Hutchinson (CSIRO). Improved climatic interpolation routines developed by Michael Hutchinson were a crucial part of the work, and including the effects of elevation as well as latitude and longitude was critically important.
The climatic interpolation routines generated reliable estimates of mean monthly maximum temperature, minimum temperature and precipitation for any location in Australia. Monthly data were estimated for each of the species distribution locations input into the programme. From these monthly data, values were calculated for variables such as the maximum temperature of the hottest month and the precipitation of the driest quarter. The range of these variables were then compared with climatic conditions estimated for a regular grid of locations across Australia. This identifies locations climatically similar to the sites where the species is known to occur. These grid points suggest other locations where the species may be found.
An example: De Vis’ banded snake
One of the earliest BIOCLIM studies was of 78 venomous snakes (Longmore 1986, Nix 1986). For example, locations for De Vis’ banded snake also known as the Mud Adder (Denisonia devisi) were analysed and a map produced using data from BIOCLIM.
De Vis’ banded snake (Denisonia devisi) [Source: iNaturalist, CC-BY-NC-Int license, © Neville Hayes some rights reserved]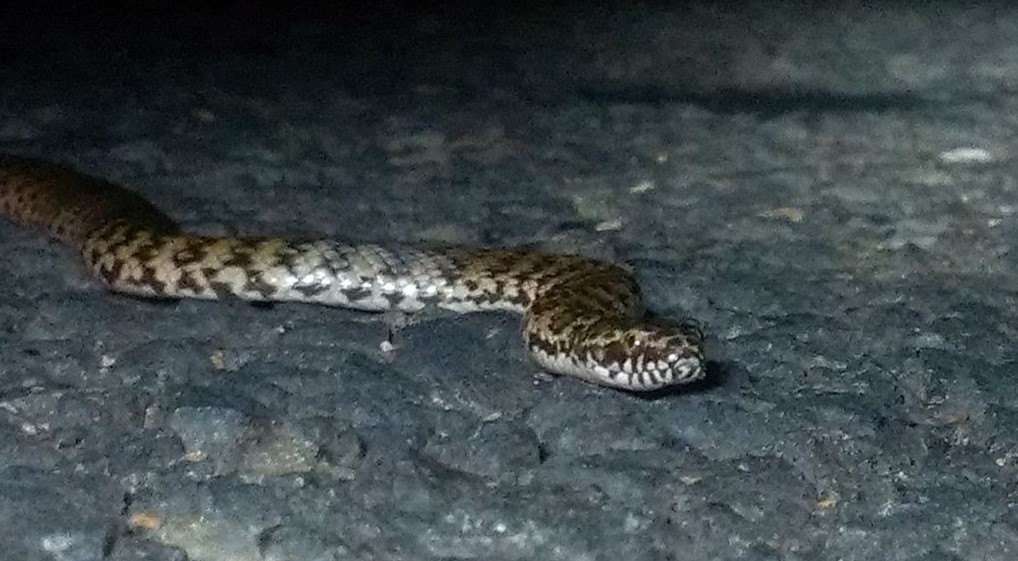
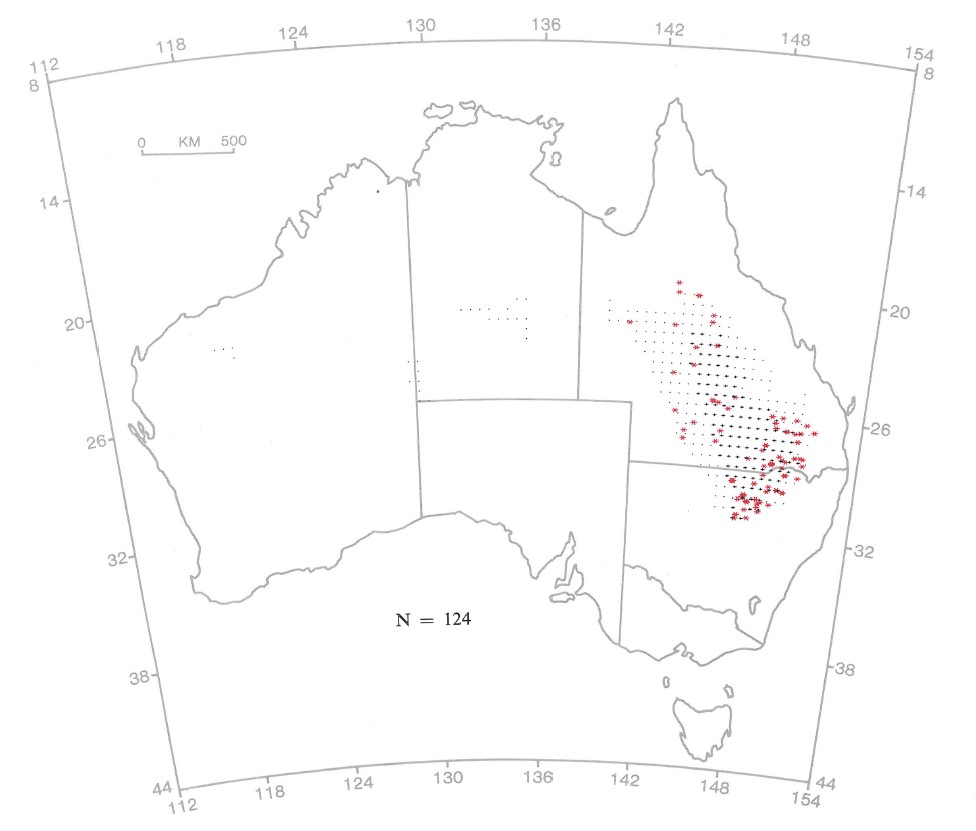
Map created using BIOCLIM data for De Vis’ banded snake (Denisonia devisi). Red stars indicate 124 observed occurrence locations. The ‘+’ symbols indicate core locations and ‘.‘ symbols indicate marginal locations according to the BIOCLIM analysis (from Nix (1986) in Longmore (1986)).
The Atlas of Living Australia (ALA) now has more than 600 locational observations for De Vis’ banded snake, including a few outliers. The most notable outliers near Mildura appear to be associated with snakes carried south along rivers during flooding. However, the vast majority of the ALA observations confirm the extent of the species distribution as indicated by the core locations, and many of the marginal locations in Queensland and New South Wales, suggested by BIOCLIM.
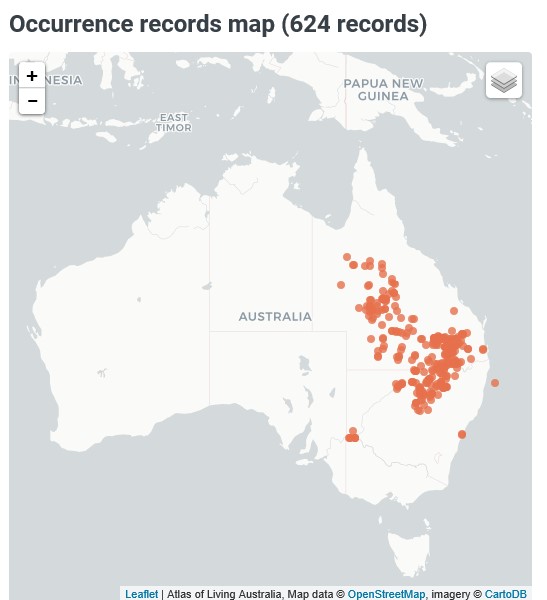
Occurrence map for De Vis’ banded snake (Denisonia devisi) from the Atlas of Living Australia
The impact
This concept has proved to be an enormously powerful idea around the world. Over a thousand scientific papers since 1984 have cited the original BIOCLIM work. Improvements to BIOCLIM have included the addition of interpolation relationships for solar radiation and Class A pan evaporation. The number of variables used increased from 12 in 1984 to 35 in 1999. Though BIOCLIM is still widely used particularly for teaching and comparative purposes, more sophisticated SDM analysis methods have also been developed. Many of these still use a set of 19 variables developed for BIOCLIM. Most use global climatic data developed using refined versions of the interpolation routines originally developed for BIOCLIM. A search in Google Scholar for “species distribution model” shows that the current year (2018) is tracking towards more than one thousand SDM publications being produced in this year alone. These numerous publications not only advance fundamental science, but also have enormous practical impacts on planning at local, national and global levels.
References
Booth, T.H., Nix, H.A., Busby, J.R., Hutchinson, M.F. (2014) BIOCLIM: the first species distribution modelling package, its early applications and relevance to most current MaxEnt studies. Diversity and Distributions 20, 1-9. Free access at https://onlinelibrary.wiley.com/doi/abs/10.1111/ddi.12144
Busby J. R. (1991) BIOCLIM – a bioclimate analysis and prediction system. pp. 64–68 in Margules, C.R. and Austin, M.P. (eds). Nature Conservation: Cost Effective Biological Surveys and Data Analysis. CSIRO: Melbourne.
Hutchinson, M.F. (1989) A new objective method for spatial interpolation of meteorological variables from irregular networks applied to the estimation of monthly mean solar radiation, temperature, precipitation and windrun. CSIRO Division of Water Resources Technical Memorandum (89/5): 95-104. Free access at https://www.researchgate.net/messages/1022676879
Longmore, R. (1986) Atlas of Elapid Snakes of Australia: Australian Flora and Fauna Series 7. Bureau of Flora and Fauna, Canberra.
Nix H. A. (1986) A biogeographic analysis of Australian elapid snakes. pp. 4-15 In Atlas of Elapid Snakes of Australia: Australian Flora and Fauna Series 7 (ed R. Longmore), Bureau of Flora and Fauna, Canberra.
Source
Trevor Booth ([email protected])