Insulin and EGF receptor structures
The determination of the 3D structure of the insulin receptor in 2006 was a landmark achievement that will enhance our understanding of how insulin functions in the body. This work paves the way for future research that could lead to new therapies for diabetes or cancer. Although the insulin receptor was discovered in 1969 and its amino acid sequence determined in 1985, its 3D structure was unknown until a team of CSIRO researchers led by Colin Ward made the breakthrough in 2006. For 20 years laboratories around the world had tried and failed to solve this problem.
The team responsible has been at the forefront of research on the insulin receptor family since the early 1990s, and was awarded the CSIRO Chairman’s Medal in 2006. With their colleagues at the CRC for Cellular Growth Factors they also solved the structures of two members of the epidermal growth factor receptor family, EGFR in 2002 and ErbB2 in 2003. Both are well established targets for anticancer therapies. To have been the first to solve the structures of both the insulin receptor and the EGF receptor was a major coup for CSIRO and Australian science.
Milestones in insulin research
The CSIRO work follows on from the discovery of insulin in 1922, by Banting and Best and Collip and Macleod, for which Banting and Macleod received the Nobel Prize. This discovery had a dramatic impact on the treatment of Type 1 diabetes. It was another thirty years before Fred Sanger, in the early 1950s, determined the amino acid sequence of insulin, for which he was awarded his first Nobel Prize. Finally in 1969, the three-dimensional structure of insulin was determined by Dorothy Hodgkin who had received the Nobel Prize in 1964 for her work on the structure of vitamin B12. These major milestones in insulin research represented great challenges that took time to overcome.
Early work on the insulin receptor
Characterisation of the insulin receptor proved equally elusive. It was first isolated by US researchers in 1969 and its sequence determined independently by Axel Ullrich and colleagues at the US biotechnology company Genetech and by Bill Rutter and colleagues at the University of California in San Francisco. The crystal structure of the kinase domain (the part of the receptor that is inside the cell) was reported in Nature in 1994 by Steve Hubbard, Wayne Hendrickson and colleagues at Columbia University, New York, USA. However, attempts to reveal the molecular structure of the part of the receptor that binds insulin and is located on the outside of the cell, were unsuccessful. Several laboratories in the US and Europe had worked on this problem for almost 20 years, but without success.
Determining the insulin receptor structure ‘ a formidable problem
The insulin receptor represents a major challenge for protein crystallographers. It is a large, disulphide-bonded protein dimer that is heavily glycosylated. There are 34 N-linked glycans and 12 O-linked glycans attached to the insulin receptor dimer and a total of 40 disulphide bonds. Each monomer of IR is cleaved into an N-terminal α-chain and C-terminal β-chain. The portion of the IR dimer residing outside the cell contains 1 834 amino acids (including 388 residues from the β-chain) but only α-chain residues are involved in insulin binding.
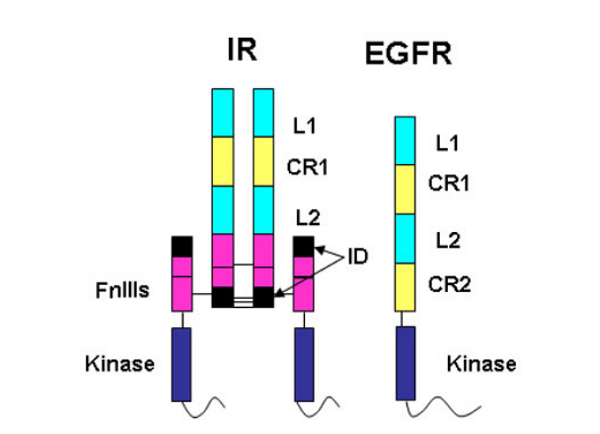
The amino acid sequences revealed that the IR monomer consists of several structural domains. These are: the leucine rich repeat domain L1 (residues 1-157); a cysteine rich region (CR, residues 158-310) made up of seven smaller disulphide linked modules and a second leucine rich repeat domain L2 (residues 311-470). These three domains are followed by three fibronectin type-III domains: FnIII 1 (residues 471-595), FnIII 2 (residues 596-808) and FnIII 3 (residues 809-906). The second fibronectin type-III domain (FnIII 2) contains a ~120 residue insert termed the insert domain (ID) which contains the α/β cleavage site. C terminal of FnIII 3 lies a single transmembrane helix followed by a 40 residue intracellular juxtamembrane region (JM), a tyrosine kinase (TK) catalytic domain and a ~100 residue C tail. The type 1 insulin-like growth factor receptor (IGF-1R) is similarly ordered.
In 1995 Colin Ward and colleagues using sequence profile analyses predicted that the disulphide bond arrangements in the CR regions of both the insulin receptor (IR) and the epidermal growth factor receptor (EGFR) would resemble the pattern reported in the crystal structure of the unrelated tumour necrosis factor receptor, a cysteine rich protein. When Joseph Schlessinger’s laboratory (Abe et al., 1998, J. Biol. Chem., 273: 11150-11157) published the experimentally determined disulphide bond arrangements of EGFR three years later they commented that surprisingly these predictions are correct despite the rough assumption
The strategy
The science involved is structural biology. The protein of interest is grown in and secreted by cells and then isolated from the culture medium, purified and crystallised. The crystals are bombarded with beams of X-rays and data about the protein’s make-up is gradually assembled and converted into electron density maps. These maps are interpreted using the amino acid sequence of the protein, and a full picture of the receptor structure emerges.
In this program, obtaining good crystals was the most difficult hurdle to overcome. Although crystals were frequently obtained, they didn’t diffract the X-rays, or diffracted them poorly. To address this problem the team made many different receptor constructs from all three members of the insulin receptor family (the insulin receptor, the type 1 IGF receptor and the insulin receptor related receptor). In addition they used different cell lines for expression and protein production, explored very subtle methods for high resolution protein purification, and used a variety of protein treatment protocols prior to conducting the crystallisation screens.
First success with receptor fragments
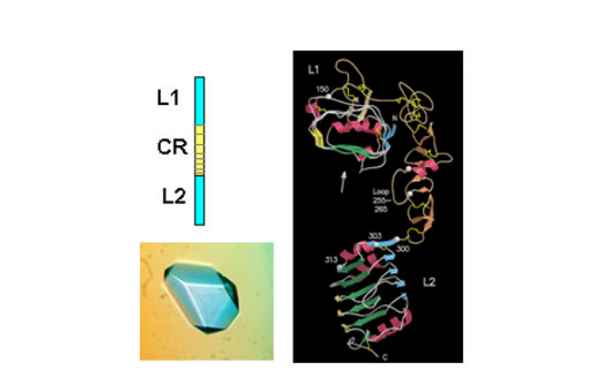
The first success came when they solved the 3D structure of the N-terminal half of the insulin-like growth factor receptor (IGF-1R) ‘ published in Nature in 1998. This 460 amino acid fragment consisted of the first three domains (called L1, CR, L2) of IGF-1R and revealed for the first time that the L1 and L2 domains were leucine-rich repeats. The structure also revealed that the published sequence changes associated with loss of insulin binding in mutated receptors or receptors from leprechaun patients, were all located on the central β-sheet of the L1 domain. The crystals were grown by Meizhen Lou and the crystallographer involved was Tom Garrett who had been recruited, in 1990, to the Biomolecular Research Institute (a joint venture between CSIRO and the Victorian Government’s Strategic Research Foundation). The structure also confirmed the modular nature of the cysteine-rich domain as predicted in 1995 by Colin Ward and colleagues from amino acid sequence analyses.
In 1998 Colin Ward used sequence analyses to predict that there was a third fibronectin type III domain in the insulin receptor (IR) between the L2 domain and the two previously identified FnIII domains at the C- terminal end of the IR extracellular region. Three other groups independently reached the same conclusion.
Subsequently, in 1999, the CSIRO group published striking single molecule electron microscopy images, taken by Peter Tulloch, of the insulin receptor dimer with and without various combinations of three different monoclonal antibody fragments. In the same year they also determined the structure of the L1-CR-L2 fragment from the insulin receptor. The IR and IGF-1R structures, as expected, were very similar and the IR structure was not submitted for publication until 2006 in the Proceedings of the National Academy of Science, USA.
A diversion ‘ the structures of members of the epidermal growth factor receptor family
The epidermal growth factor receptor family
The epidermal growth factor receptor (EGFR) family members are also tyrosine kinase receptors that are structurally related to the insulin receptor. They have the same L1-CR-L2 domain organisation in their extracellular portion followed by a second cys-rich domain CR2 rather than the three fibronectin type III domains found in the IR family. Thus the IGF-1R fragment structure provided insight into the structure of the EGFR family members, an area of interest to Professor Tony Burgess and his colleagues at the Ludwig Institute for Cancer Research in Melbourne.
The biology and biochemistry of the EGFR system had intrigued scientists and clinicians for more than thirty years. The EGFR was the first tyrosine kinase receptor to be identified and has been the subject of intense scientific research ever since. Once it became clear that this receptor system provided the first clues to the molecular causes of cancer, the discoverer of EGF and its receptor, US researcher Stanley Cohen, was awarded the Nobel Prize in 1986. Subsequently three other members of the EGFR family of tyrosine kinases were identified in vertebrates referred to as ErbB2, ErbB3 and ErbB4. They are capable of forming homo- or hetero-dimers following activation by a subset of a dozen potential EGF-like ligands. One puzzling feature in this system is ErbB2, which has no known ligand, yet seems to be the preferred partner for hetero-dimerisation with the other activated EGFR family members.
The crystal structures yield several surprises
Since 1980, a large international effort has been mounted to understand the structure and function of this important family of receptors with the aim of developing new anti-cancer agents. Since the late nineties the number of publications on the EGFR system has numbered 800 or so per year. Determining the structure of the EGFR has been viewed as a major prize in cancer research and for over 20 years there had been a stream of publications reporting partial progress towards that goal.
In a six year collaboration from 1997 to 2003, a team of scientists led by Colin Ward solved the structures of the activated 2:2 complex of the EGFR bound to its ligand TGFα, as well as the 3D structure of ErbB2, the promiscuous partner which does not bind ligand but still acts as the major signalling partner for other activated EGF/ErbB receptors. The research team came from CSIRO Health Sciences and Nutrition, the Ludwig Institute for Cancer Research and the Walter and Elisa Hall Institute for Medical Research (with additional support from the CRC for Cellular Growth Factors). The crystals were grown by Meizhen Lou and the crystallographer involved was Tom Garrett. Following the closure of the BRI at the end of 2000 both Mei and Tom moved to the Walter & Eliza Hall Institute of Medical Research.
Unravelling the structural details of EGFR family signalling yielded several surprises. The first was the finding that the arrangement of the 2:2 complex of EGFR and its ligand TGFα was in a ‘back-to-back’ orientation where the dimer interface is formed only by receptor-receptor contacts involving residues predominantly from the first cysteine-rich region (CR1). The two ligand molecules are located on opposite sides of the complex, each making contact with only one EGFR molecule in the dimer. This is very different to the arrangements seen with many other receptors where the ligand(s) are located at the centre of the complex.
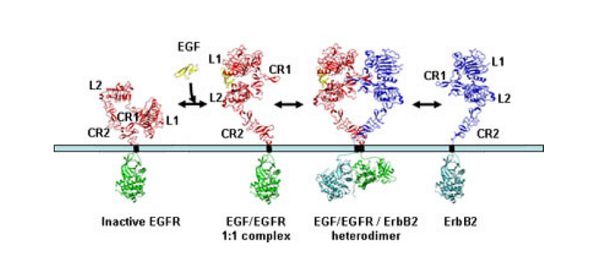
The second surprise came when researchers in the USA reported that in the absence of growth factor, the EGFR is folded over on itself in a tethered conformation stabilised by interactions between loops on the second (CR1) and fourth (CR2) domains. On binding ligand each EGFR receptor opens out into an extended conformation which exposes the surface involved in dimerisation. This raised the question of how ErbB2 is regulated given it does not bind ligand yet is the preferred partner in ligand-mediated signalling by the ErbB family.
The answer came when the Australian group, simultaneously with Dan Leahy’s group at the Johns Hopkins University School of Medicine, Baltimore, USA, determined the structure of ErbB2 and found that it was not folded over on itself but already existed in the extended conformation that mimics the ligand-bound state of EGFR. The ErbB2 protein is thus poised to interact with other members of the ErbB family once they are activated by ligand-binding.
The research results were published in three seminal papers in Cell, Molecular Cell and Biochemistry. The work stimulated major interest and discussion with editorial and commentary articles in several of the world’s top journals. As a follow up, more than forty scientists from laboratories around the world came to Australia during March 23-27, 2003, to discuss the implications of these findings. The meeting was held at Lorne in Victoria and was titled ErbBs on the beach ‘ with apologies to Neville Shute.
Selective reagents for tumour cells
EGFR is involved in stimulating the growth of many human tumors, but the success of therapeutic agents has been limited in part by interference from the EGFR on normal tissues. The Ludwig Institute in New York had generated an antibody (Mab 806) that recognised the EGFR on tumor cells but not on normal cells. In collaboration with the Ludwig Institute and WEHI the epitope for this antibody was identified by CSIRO’s Tim Adams and Peter Hoyne as the seventh cys-rich module (residues 287-302) in the first cys-rich region CR1. The discriminatory binding was shown to be due to the presence of a cryptic epitope generated by incorrect local disulphide bond formation in overexpressed receptors on tumour cells. This discovery suggests the possibility of generating antibodies to target other wild-type receptors on tumor cells.
Back to the insulin receptor dimer
While all this was going on work continued on the goal of solving the structure of the whole insulin receptor ectodomain with Mike Lawrence as the senior crystallographer. Success finally came as a result of a whole series of improvements including the strategy of antibody-mediated crystallisation where the insulin receptor dimer is decorated with four monoclonal antibody fragments which result in the heavily glycosylated receptor itself not being involved in crystal contacts.
The other novel aspect to the project was the use of a recently published maximum likelihood program BUSTER-TNT (Blanc et al., 2004, Acta Cryst. D. Biol. Cryst., 60: 2210-2221). This program assists the refinement of incomplete and low resolution structures by accounting for some of the scattering from the part of the structure that is missing. The insulin receptor project is one of the first to which this method was applied. The group made use of synchrotron radiation at:
- the Advanced Photon Source, Argonne, Illinois, USA
- the ESRF at Grenoble, France
- the Swiss Light source in Zurich, Switzerland
- the Photon Factory, Tsukuba, Japan.
The structure ‘ a thing of beauty
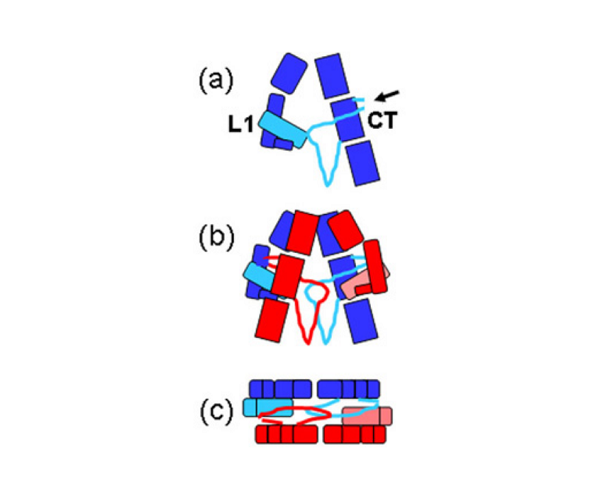
The structure reported in Nature (14 September 2006) reveals how the 14 protein domains of the extracellular portion of the insulin receptor are organised in the dimer to bring the ligand-binding regions into juxtaposition and suggests how the high-affinity insulin-insulin receptor complex, which leads to signal transduction, is generated. The insulin receptor exhibits an unexpected folded-over inverted ‘V’ conformation that is very different to previous models described in the literature. One leg of the V is formed by the L1-CR-L2 fragment and the other by the three fibronectin type III domains, the third of which is at the base of the inverted V structure. In the intact receptor the polypeptide chain would extend through the cell membrane.
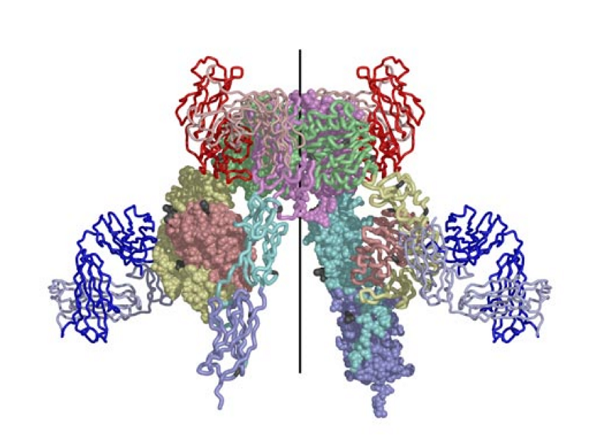
The IR dimer has two identical insulin binding sites on each side of the structure. Analysis of the structure revealed that each binding site consists of the central β-sheet of the L1 domain from one monomer and a stretch of 16-26 residues from the C-terminal end (CT) of the α-chain from of the other monomer. This peptide was seen to be lying over the L1 surface and together L1 and CT comprise the initial binding surface (the low affinity binding site). The resolution of this region of the receptor was insufficient to indicate whether the CT peptide came from the same monomer as its adjacent L1 domain partner or came from the alternate monomer. The latter was predicted to be the case by Colin Ward given (as show in panel (b) of the schematic below) this would be the arrangement in the IR proreceptor dimer before cleavage into the α and β-chains. This arrangement has subsequently been confirmed biochemically.
The structure also revealed that high affinity binding involves residues from the loops at the junction of the first and second FnIII domains of the second monomer. Bridging contacts made by insulin across the two receptor monomers induce an as yet unidentified conformational change/domain re-arrangement that results in activation of the tyrosine kinas domain inside the cell.
Thus the insulin receptor surprisingly uses binding modes from two different receptor classes: leucine-rich repeats as seen in the epidermal growth factor receptor (EGFR) family and the leucine rich G-protein-coupled receptor (LGR) family and fibronectin type-III domain loops as seen in the growth hormone receptor and other members of the interleukin cytokine receptor family.
Implications for the insulin-like growth factor receptor
The insulin receptor structure reveals a great deal about the structure of the closely related insulin-like growth factor receptor (IGF-1R). The challenge for the future is to understand how insulin or IGF binding to their receptors triggers off cellular events that regulate the body’s uptake and use of sugar in the case of insulin or stimulate unregulated cell growth in the case of the IGFs. This information will facilitate the use of techniques such as fragment-based drug discovery to design novel therapeutic agents that can regulate the functioning of either IR or IGF-1R for the treatment of diabetes and cancer respectively, two of the major health problems facing the world in the 21st century.
Key CSIRO scientists involved
Over the period from late 1990 to 2006 many people contributed to various aspects of this research program. The key CSIRO contributors were: Tim Adams, John Bentley, Leah Cosgrove, Tom Elleman, Vidana Epa, Morry Frenkel, Tom Garrett, Peter Hoyne, Mike Lawrence, Meizhen Lou, George Lovrecz, Neil McKern, Lindsay Sparrow, Victor Streltsov, Peter Tulloch and Colin Ward.
Source
- Ward CW, 2009, Personal communication.
- Aussie team makes landmark insulin discovery, 2006 (Media Release)
- Insulin receptor researchers win top CSIRO award, 2006 (Media Release)
- CSIRO completes its insulin receptor research (Statement)
- Innovations: Insulin Discovery Key To New Diabetes Therapies – Dr Colin Ward, 2006 (ABC Radio Australia)